A product manager mock interview usually goes wrong in the second half. The first five minutes are the part everyone has rehearsed: clarify, name a user, lay out a structure. Then the interviewer says “how would you show that this explains the whole eight percent?” or tells you the finance team “wants it live for everyone next month. What do you say?”, and the rehearsed part is over. Sample answers do not prepare you for that moment, because a sample answer never gets interrupted.
This post takes apart five mock interviews from PM Interview Prep: AI Coach Edition, a course on Tough Tongue AI. Each is a voice round of about 30 minutes with an AI interviewer named Ben, followed by a written report. I picked five that test different things. For each one you get the question as Ben asks it, where he pushes, a weak answer next to a strong one, and what the report scores. The weak and strong answers are examples I wrote to show the difference. They are not transcripts of real candidates.
Two notes before we start. I give away parts of each case. That is fine, because the rounds score how you get to the answer. And the cases are set at real companies, but every number in them is made up for the exercise, which Ben says once during the call. The rooms are styled after rounds candidates report, not any company’s real process. If you want the map of PM question types first, our general PM interview guide covers that.
1. Root cause analysis: why did the metric drop?
Ben opens with: “You’re a PM at Instagram, on the home feed. Weekly feed impressions are down eight percent compared with last week. Why, and what do you do?” He holds a data sheet and gives one cut at a time, only when you ask. Ask for a cut that is not on the sheet and it comes back flat, within about one percent.
This is the round that punishes guessing. Because the data is hidden, the order of your questions is your answer. There are three red herrings waiting: a Reels-tab layout test on five percent of users, a seasonal dip of about one percent in the same week last year, and a rival launch that cannot be verified.
Ben’s favorite questions here are “Why that cut first?” and “How would you know?” Expect “Walk me through your first three cuts, and why those,” then “How would you show that this explains the whole eight percent, not a piece of it?” The curveball: the fix needs about five days to ship and clear store review, and the head of growth wants to send a win-back email to every Android user today. Do you?
A weak answer sounds like this: “It could be the Reels test, or a competitor. I’d look at the dashboards and sync with engineering.” There is no cut in it and nothing to prove. A strong answer first asks whether the drop is a step or a slope and whether server counts agree with logging, then splits impressions into users, sessions per user and impressions per session. On Ben’s sheet, sessions per user carry it (down seven percent). Platform comes next: iOS is flat and Android is down 16 percent. Android 14, which is 40 percent of Android sessions, is down 40 percent. Half of Android 14 sessions start from a push notification, and those are down 80 percent, because a release on Tuesday moved Android to a new notification library and delivery fell from about 90 percent to about 18. Then the proof, said aloud: half of sessions, times 40 percent, times half, times 80 percent, is eight percent.
The round ends on a trade-off. Two weeks later, a daily “you missed this” notification lifts feed impressions four percent over control, while people turning notifications off go from one percent a week to three. The strong read is that the bump is temporary and the loss is permanent. Two extra points a week for two weeks is about four percent of the group losing push for good, and push starts half of their sessions, so about two percent of their sessions are at risk every week from then on. Hold it or change it, and name the turn-off rate that would make you stop.
The report scores six lines: clarify and define (10%), structure and cuts (20%), evidence and proof (20%), fix, prevention and the leadership note (15%), real-PM judgment and the trade-off (25%), and communication (10%). Never cutting the drop, or never attempting the proof, is a knock-out to No hire whatever the score. Run the root cause mock. For a different drop worked on paper, see our Reddit root cause walkthrough.
2. A/B test interview: design the test, then read the results
“You’re a PM at Plaid. A large US streaming service, one of your customers, wants to add bank transfer payments, called ACH, at checkout. What test would you run to help them decide whether to make it available to everyone?”
Most experimentation questions stop at the design. This one has a second phase: once you have said how you would decide, Ben hands over a results sheet from “a test like yours” and asks what you see. That is where the round is won. He never says what the numbers mean. If you ask whether something is significant, he reads the interval back to you.
The design follow-ups are “Who exactly gets randomized, and why that unit?” and “How big does the test have to be, and how long does it run?” The baseline is 61 percent of visitors on the payment page finishing, with about 8,000 new visitors a day. To detect a one point lift on that base you need roughly 37,000 to 38,000 visitors per arm, which is nine to ten days of traffic split two ways, rounded up to two full weeks. The detail that separates candidates is the window: a failed bank pull comes back two to five days after the charge date, so a test that only watches checkout will miss it.
Then the results. A weak read: “Conversion went from 61.0 to 62.2 and the interval is plus 0.6 to plus 1.8, so it is significant. Ship it.” A strong read keeps going. Thirty-day payment failure is 2.1 percent in control and 4.5 percent in the ACH arm, and ACH payers alone fail 8.0 percent of the time. So paid and active at day 30, per visitor, is 59.7 percent in control and 59.4 percent with ACH. The interval on that difference runs from minus 0.9 to plus 0.3. The lift at checkout is real, and it is gone a month later. So the strong call is neither ship nor kill: ramp slowly with instant bank verification to bring the failures down, and keep a holdback group so the day 30 number stays measurable.
The curveball comes from finance: ACH is cheaper per charge, so make it live for everyone next month. On the fact sheet a card charge costs about 76 cents and an ACH charge about 13, a saving of 63 cents. But ACH payers fail 5.9 points more often than card payers (8.0 against 2.1), and 5.9 percent of a 16 dollar first month is about 94 cents. The fee saving is smaller than the revenue lost. The trade-off turn then sets a trap. In a second test, ACH payers cancel in month two at twice the rate of card payers. Those people chose their own payment method, so that gap is not a test result. Arm against arm, month-two cancels are 5.2 percent against 5.
The report weights: hypothesis and unit (10%), metrics, guardrails and window (20%), size and duration (15%), reading the results and the call (20%), real-PM judgment and the trade-off (25%), communication (10%). Run the A/B test mock. Our Facebook Reactions rollout post covers a different launch decision in the same family.
3. Pricing interview question: what should Max pay for a button on Roku’s remote?
“You’re a PM at Max, HBO’s streaming service. Roku wants to put a Max button on its new remote control. How much should Max pay for it?”
Most pricing practice asks you to set a price for your own product. Here you are the buyer, the other side has already named a number, and the test is whether you build your own value before you react to theirs. Roku’s ask on the fact sheet is 40 million dollars a year, flat, for two years. Ben’s two favorite questions in this room are “Whose dollars?” and “What would you cut?”
The follow-up that decides the round is “Of the sign-ups you count, how many would you have got anyway?” Then “Flat fee or a payment per sign-up?” The curveball: Roku says two other services have offered close to its ask, and if you pass, a rival gets the button. What happens to your number?
On the fact sheet, 80 million households use Roku and a quarter already subscribe to Max, which leaves 60 million. About four percent of those press a service’s button in a year, or 2.4 million, and about 30 percent of them start a paid plan. A weak answer stops there and multiplies by revenue: 720,000 new members at 10 dollars a month for 14 months is about 100 million dollars, so 40 million looks cheap. A strong answer removes two things. Half of those members would have signed up anyway through search, ads or friends, which leaves 360,000. And only about 60 percent of revenue is left after content and streaming costs, so a member contributes 84 dollars, not 140. The button is worth about 30 million dollars a year. The ask is a third above that.
- 160 million households to win80 million use Roku. A quarter already subscribe.
- 22.4 million press the buttonAbout 4% of non-subscribers in a year.
- 3720,000 start a paid planAbout 30% of those who press.
- 4360,000 are incrementalHalf would have come anyway.
- 5$84 contribution each$10 a month × 14 months × 60% left after costs.
- →About $30 million a year, against a $40 million ask
With a ceiling in hand, the rival bids matter less. Defensive value is real, but it has a price, and a walk-away line that moves because someone else bid was never a line. A per sign-up deal gets simple too: 40 dollars per incremental sign-up is about 14 million a year at these numbers, and 84 is the most you could pay.
The trade-off turn comes a year in. Sign-ups are on plan, but members who joined through the button stay about eight months, not 14. Re-run it: 10 dollars times eight months times 60 percent is 48 dollars, and 360,000 of those is about 17 million a year. “Sign-ups are on plan” was hiding a value cut nearly in half.
Value and pricing logic is 25 percent of the report and real-PM judgment and the trade-off is 30 percent, the heaviest single line in any of these five. Scope, goal and why now is 15, options and structure 20, communication 10. Run the pricing mock.
4. AI product sense interview: evaluate a support agent before and after launch
“You’re a PM at Google, on the team that builds an AI agent businesses use to resolve their customer support tickets on their own. Your launch customer is Tidewell, a made-up accounting software company. How would you design the evaluation framework, before launch and after? Ask me for what you need.”
This is the round least like a classic PM question. Ben says up front that he does not expect model training or code. He cares how you decide. A tool name with no reason is not an answer in this room: he will ask what it tells you.
He always asks, early, “Which of these tickets is an agent the right tool for, and which not?” Tidewell gets about 3,000 tickets a day: 40 percent “how do I” questions, 25 percent billing and refunds, 20 percent bug reports. Tax and payroll questions must always go to a human. Later come “Who or what grades the answers, and how do you know the grader is right?” and “Give me one action you’d never let it take alone.” The curveball is the one I like most in the whole course. A new model scores six points higher on your test set. In the live test, resolution is up a little, satisfaction is flat and reopened tickets are up. What do you do?
The weak answer ships the better offline model, or blames the live test. The strong answer says the test set and the live product now disagree, so the test set is measuring good-sounding answers and not problems that stay solved. Read the reopened tickets, split by ticket type, and add the failures to the test set before widening anything.
The trade-off turn repeats the lesson with numbers. The agent is live on “how do I” and billing tickets. Cost per resolved ticket fell from about six dollars to about three, and satisfaction slipped from 82 percent to 79. A weak answer: “Cost halved and we lost three points. Widen it.” A strong answer asks for the split.
“How do I” tickets went from 84 to 85, and the tickets still with humans stayed at 82. Billing fell from 80 to 66. On those tickets, people who asked for a human had to ask about twice before the handoff, and refund answers were right but read as curt. So the call is to keep “how do I”, pull billing back a rung so the agent drafts and a human approves, make the human reachable on the first ask, and set a satisfaction line per ticket type for widening.
The report: AI product framing (15%), evaluation design (20%), metrics and guardrails (15%), failure modes and human in the loop (15%), real-PM judgment and the trade-off (25%), communication (10%). Never saying why an agent fits these tickets, even when asked, is the knock-out. Run the AI product sense mock. For an AI design question, as opposed to an evaluation one, see the children’s AI storyteller case.
5. Product sense interview: design a product for borrowing and lending
“You’re a PM at Meta. Design a product for borrowing and lending.”
The brief is open on purpose. If you ask whether it is money or things, Ben says “Your call. Tell me which and why.” No other round here gives you this much room. Ben is scoring the choices more than the ideas: which user, which pain, which solution, what is cut.
After you list options he asks, “You gave me three. Would any of them fail for the same reason?” Later, “I’m taking a third of the team. What do you cut?” The curveball is built from your own answer. He picks the feature your first version leans on most for trust, such as identity checks, deposits or a reputation score, and says legal cannot ship it for eight months while launch is still in four.
A weak set of three: a lending app, the same app with ratings, the same app with chat. One idea, three skins, and all three fail if lenders do not show up. A strong set differs in kind: a request post to a trusted circle of friends of friends, shared neighbourhood lockers, and a “list your garage in five photos” matcher as the stretch. Then a first version with a cut line: request, one-tap offer, return reminder and a photo at handoff are in. Payments, deposits and insurance are out.
The trade-off turn is where this round stops being a design exercise. Two months into one city, completed loans are up about 40 percent month on month and disputes per thousand loans have doubled. Next city, hold, or change? Ask where the disputes come from and Ben hands over the cuts: about two thirds are between people with no friend in common, and about two thirds involve items worth over 100 dollars. Friends of friends are about half of all loans, with a dispute rate that is about flat. And about half of lenders who had a dispute have not lent again. Lenders are the scarce side, so the growth is borrowing from next month’s supply. The last question is always “So what do we build first, on Monday?”, and it wants one sentence.
Never picking a user or naming a pain is the knock-out in this room. Run the borrowing and lending mock.
Which product manager mock interview to run first
The right first PM mock interview depends on where you are, more than on which topic you like. If you have never done one, start with root cause. It has a definite answer, so the report can tell you plainly whether you cut the number or guessed at it. If your loop is a week away, do not tour all five. Pick the type you are least sure of, run it, read the report, and run it again two days later. If you come from analytics or consulting, the numbers rounds will feel like home, and the open design round is where you will learn the most. If the role is at an AI company, do the AI product sense round and then the course’s AI Lab Room, a longer two-round practice room in the style of an AI lab loop.
What an AI interviewer is good and bad at
It is good at the thing that is hardest to get from a friend: consistent pressure. Ben asks one question per turn, does not teach or hint, and does not praise. If an answer runs long he says “Let me stop you there.” He will not correct your arithmetic. He will ask you to check it. You can run the same round three days in a row and the curveball still arrives.
It is bad at several things. It does not know any company’s private rubric, so the hire band in the report (Strong hire, Hire, Lean hire or No hire) is this course’s band and nobody else’s. A 30 minute voice round is tiring, and two in one evening is usually one too many. The report grades what you said, not what you meant: if you knew the drop needed proving and never said the multiplication aloud, the report will mark the proof as missing. And an AI interviewer has no taste in the human sense. It can tell that your three solutions are one app in three skins. It cannot tell you your idea is boring. Before a real loop, get at least one session with a person.
The lab behind the root cause round
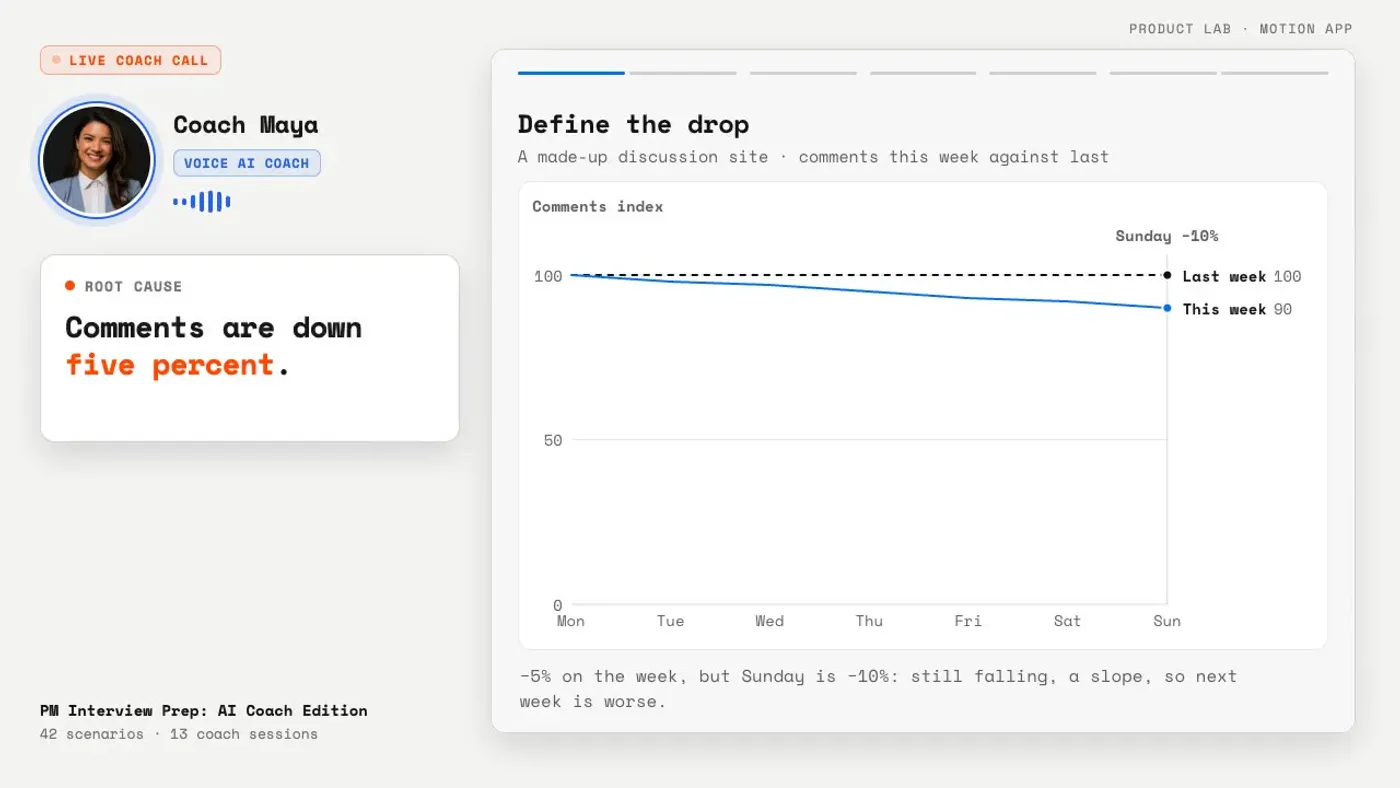
Each of these five mocks has a coach session before it, with a second voice agent named Maya. In PM Coach · Root Cause she works a different made-up drop, comments down five percent on a discussion site, on a live board beside the call. The metric sits on a plinth and the hypotheses hang off it as a tree. When she asks which cut you would try first, you tap a chip, and the board tells her what you picked before she reveals anything. Ruled-out branches grey out and get a cross, the branch that carries the drop lights up, and at the end a funnel checks that the shares multiply to the whole five percent.
What it costs
The course content is free. There is no separate course fee and nothing is locked behind a higher tier. Voice sessions use the minutes on your plan, and you can start on the free plan. The other courses are listed on the courses page.
What the five have in common
Every one of these rounds ends the same way. One number goes up and another goes down, and somebody asks you to decide. Impressions rise while notification turn-offs triple. Conversion rises while payments fail. Sign-ups hold while members leave sooner. Cost halves while billing customers get angrier. Loans grow while lenders quit.
That matches the job. A PM’s decisions rarely arrive as a clean question with one metric attached. The ones that matter tend to have a number someone wants to celebrate and a quieter number moving the wrong way behind it. The habit these rounds reward is small: before you decide, ask where the change comes from, find who is paying for it, and say what would change your mind. You can practice that with an AI interviewer, with a friend, or alone with a timer, as long as you practice the second half of the interview as often as the first.